PHASE3: Cost-based directed graph generation to PostGreSQL
Summary
Uses ASTER3 satellite DEM (digital elevation map) files to create node/edge graph that is stored into the database. Creates graph node for each smallest tile unit in DEM file. Creates directional edges (maximum: 8) for all neighborhood nodes. The weight/Cost of edge is calculated based on land elevation and its soil-type.
Cost setting for node-traversal
Parameters in simple_cost_spec_by_db.json:
costPerOrthogonalDistance
costPerDiagonalDistance
elevationLimitsForCostIndex
elevationUnitMultiplier
costPerElevationUnit
Distance Cost: 'D' (e-g., 100) per one orthogonal distance; 1.44D for diagonal distance
Slope Cost: -2 unit elevation cost is set be to be slightly less than .44 unit of distance cost ( so that 0, -1, and -2 elevation would prefer orthogonal neighbors over diagonal ones)
Location Cost: Ganga and tributaries get MAXINT; temples/hospitals/landmarks
Geo Cost: Nature of the ground (granites costlier than sand)
Edge cost is calculated based on elevation difference and fixed cost of diagonal or orthogonal traverse:
elevationGradient = (short) (neighborNodeElevation - nodeElevation);
Find-last costIndex such that: elevationGradient >= elevationLimitsForCostIndex[costIndex]
elevationGradientCost = (int)((elevationGradient * elevationUnitMultiplier[costIndex]) * costPerElevationUnit[costIndex]);
edgeCost = elevationGradientCost + (costPerOrthogonalDistance or costPerDiagonalDistance);
E-g., calculation of elevation difference of 7 on diagonal:
For 0-100 elevation gradient (costIndex: 2), the multiplier is 2.0 and per-unit is 20
elevationGradientCost = (int)((7 * 2.0) * 20) = 280
edgeCost = 280 + 144 = 424

Ref: g2k_cost_and_constraints.png
STEP1: Complete Preparing PostGreSQL"
STEP2: generateGraph
Connect to PostGreSql container
Truncate tables:
TRUNCATE TABLE public.node;TRUNCATE TABLE public.edge;
TRUNCATE TABLE public.node_info;
TRUNCATE TABLE public.removed_edge;
STEP3: To generate the Cost-based directed graph in one or four batches:
Review ${G2K_DATA_HOME}/simple_cost_spec_by_db.json
      "totalFileBackedImagesToCache": 8,
      "jsonInputFilePath": "/opt/GangaToKaveri/data/ASTER_DEM_TIF_Files",
      "jsonInputFileRegEx": "ASTGTMV003_(?<tileName>.*)_(?<leftOvers>.*)",
      "jsonInputFileTileGroupName": "tileName",
      "binInputFilePath": "/opt/GangaToKaveri/data/ASTER_DEM_Bin_Files",
      "graphDBUrl": "jdbc:postgresql://172.23.4.30:16532/g2kpchdb",
      "graphDBSchema": "public",
      "graphDBUser": "db_app_user",
      "graphDBPassword": "db_app_pwd",
      "graphDBNodeTable": "node",
      "graphDBEdgeTable": "edge",
      "graphDBNodeInfoTable": "node_info",
      "graphDBDirtyNodesBatchSize": 1000,
      "graphDBDirtyEdgesBatchSize": 8000,
      "graphDBDirtyNodesBatchSizeDev": 200,
      "graphDBDirtyEdgesBatchSizeDev": 1600,
      "pagedGraphEdgeIdByNodeId": true,
      "graphPrehydrateNodeEdges": true,
      "graphGridDeserializingThreads": 5,
      "graphGridDeserializingThreadsDev": 3,
    "graphGridTasksForceWaitIdleCheckLimit": 100,
    "graphGridDeserializerPendingTasksSize": 2500,
    "graphGridDeserializerPendingTasksSizeDev": 500,
    "graphGridTasksForceWaitIdleCheckLimitDev": 25,
      "pagedGraphGridNodesInRow": 1200,
      "pagedGraphGridNodesInColumn": 1200,
      "pagedGraphGridEdgesInRow": 9600,
      "pagedGraphGridEdgesInColumn": 9600,
      "persistSecondaryCacheNodesAsync": false,
    "secondaryCacheNodeSize": 2097152,
    "secondaryCacheNodeSizeDev": 1048576,
    "secondaryCacheEdgeSize": 2097152,
    "secondaryCacheEdgeSizeDev": 1048576,
      "elevationForMissingNode": -500,
      "costPerOrthogonalDistance": 100,
      "costPerDiagonalDistance": 144,
      "costPerNegativeOrthogonalDistance": 90,
      "costPerNegativeDiagonalDistance": 130,
      "elevationLimitsForCostIndex": [300, 100, 0, -50, -150, -10000],
      "elevationUnitMultiplier": [5.0, 3.5, 2.0, -1.25, -2.75, -4.25],
      "elevationUnitMultiplierBad": [5.0, 3.5, 2.0, -2.5, -4.0, -5.0],
      "costPerElevationUnit": [30, 25, 20, 20, 25, 30],
      "enableCostForLandmarks": false,
      "costForLandmarks": {"Hospital": 200, "Education": 200, "Religious": 300 },
      "enableCostForGeology": false,
      "costForGeology": {"Granite": 200, "Sandstone": 150},
      "barrierByElevationAbove": 1000,
      "maxNeighborCost": 9000,
      "skipBarrierByElevationTiles": ["N30E077", "N30E078", "N30E079", "N29E078", "N29E079", "N29E080", "N28E080", "N28E081", "N28E082", "N27E082", "N27E083", "N27E084", "N27E085", "N27E086", "N26E086", "N27E081", "N26E085"],
      "skipBarrierByElevationTilesDev": ["N12E077", "N13E075", "N29E078", "N29E079", "N28E079"],
"totalFileBackedImagesToCache": 8,
"jsonInputFilePath": "/opt/GangaToKaveri/data/ASTER_DEM_TIF_Files",
"jsonInputFileRegEx": "ASTGTMV003_(?<tileName>.*)_(?<leftOvers>.*)",
"jsonInputFileTileGroupName": "tileName",
"binInputFilePath": "/opt/GangaToKaveri/data/ASTER_DEM_Bin_Files",
"graphDBUrl": "jdbc:postgresql://172.23.4.30:16532/g2kpchdb",
"graphDBSchema": "public",
"graphDBUser": "db_app_user",
"graphDBPassword": "db_app_pwd",
"graphDBNodeTable": "node",
"graphDBEdgeTable": "edge",
"graphDBNodeInfoTable": "node_info",
"graphDBDirtyNodesBatchSize": 1000,
"graphDBDirtyEdgesBatchSize": 8000,
"graphDBDirtyNodesBatchSizeDev": 200,
"graphDBDirtyEdgesBatchSizeDev": 1600,
"pagedGraphEdgeIdByNodeId": true,
"graphPrehydrateNodeEdges": true,
"graphGridDeserializingThreads": 5,
"graphGridDeserializingThreadsDev": 3,
"graphGridTasksForceWaitIdleCheckLimit": 100,
"graphGridDeserializerPendingTasksSize": 2500,
"graphGridDeserializerPendingTasksSizeDev": 500,
"graphGridTasksForceWaitIdleCheckLimitDev": 25,
"pagedGraphGridNodesInRow": 1200,
"pagedGraphGridNodesInColumn": 1200,
"pagedGraphGridEdgesInRow": 9600,
"pagedGraphGridEdgesInColumn": 9600,
"persistSecondaryCacheNodesAsync": false,
"secondaryCacheNodeSize": 2097152,
"secondaryCacheNodeSizeDev": 1048576,
"secondaryCacheEdgeSize": 2097152,
"secondaryCacheEdgeSizeDev": 1048576,
"elevationForMissingNode": -500,
"costPerOrthogonalDistance": 100,
"costPerDiagonalDistance": 144,
"costPerNegativeOrthogonalDistance": 90,
"costPerNegativeDiagonalDistance": 130,
"elevationLimitsForCostIndex": [300, 100, 0, -50, -150, -10000],
"elevationUnitMultiplier": [5.0, 3.5, 2.0, -1.25, -2.75, -4.25],
"elevationUnitMultiplierBad": [5.0, 3.5, 2.0, -2.5, -4.0, -5.0],
"costPerElevationUnit": [30, 25, 20, 20, 25, 30],
"enableCostForLandmarks": false,
"costForLandmarks": {"Hospital": 200, "Education": 200, "Religious": 300 },
"enableCostForGeology": false,
"costForGeology": {"Granite": 200, "Sandstone": 150},
"barrierByElevationAbove": 1000,
"maxNeighborCost": 9000,
"skipBarrierByElevationTiles": ["N30E077", "N30E078", "N30E079", "N29E078", "N29E079", "N29E080", "N28E080", "N28E081", "N28E082", "N27E082", "N27E083", "N27E084", "N27E085", "N27E086", "N26E086", "N27E081", "N26E085"],NOTE:
elevationUnitMultiplier is set in such a way that flat-land (gradient=0) is preferred than down or up slope. Also, up slope (indeces 0,1) are bit more costlier than down slopes (indeces 3,4)
pagedGraphGridNodesInRow and pagedGraphGridNodesInColumn could be comparable in size to DEM tile size, 3600 (need not be too small)
pagedGraphGridEdgesInRow/pagedGraphGridEdgesInColumn are 8 * pagedGraphGridNodesInRow/pagedGraphGridNodesInColumn
graphGridDeserializingThreads/graphDBDirtyNodesBatchSize/graphDBDirtyEdgesBatchSize are tuning parameters for how fast INSERTs are done
graphGridDeserializerPendingTasksSize is set to 2500 to keep many pending tasks in UPSERTs pipeline (and NOT to force-wait often for completion)
skipBarrierByElevationTiles set tile tags at source and destination regions where tall mountains should NOT be treated as barrier
totalFileBackedImagesToCache should be at least two rows of the tiles (8 for DEV; 12 for prod)
maxNeighborCost is the upper limit of any edge cost (200times5.0elevationUnit30costPerElevation) -- so that any ridge-like noisy neighborhood elevation values causes path-calculation issue (e-g., cost of 151930 for edge between 51838320 and 51859919
Edge cost is calculated based on elevation difference and fixed cost of diagonal or orthogonal traverse:
elevationGradient = (short) (neighborNodeElevation - nodeElevation);
Find-last costIndex such that: elevationGradient >= elevationLimitsForCostIndex[costIndex]
elevationGradientCost = (int)((elevationGradient * elevationUnitMultiplier[costIndex]) * costPerElevationUnit[costIndex]);
edgeCost = elevationGradientCost + (costPerOrthogonalDistance or costPerDiagonalDistance);
E-g., calculation of elevation difference of 7 on diagonal:
For 0-100 elevation gradient (costIndex: 2), the multiplier is 2.0 and per-unit is 20
elevationGradientCost = (int)((7 * 2.0) * 20) = 280
edgeCost = 280 + 144 = 424
Calculating number of logical tiles/rowIndices
Nodes per DEM grid-file: 36003600=12960000
Number of grid-files in problem set: 110 (Old:108)
Total nodes in problem set: 11012960000=1425600000 (Old:10812960000=1350969135)
Number of nodes per logical tile: pagedGraphGridNodesInRowpagedGraphGridNodesInColumn=12001200=1440000
Total points in rigid rectangle: demImageRowsxdemImageColumns=6120025200=1542240000
Number of logical tiles: 1542240000/1440000=1071 tiles (Old: 1350969135/1440000=972 tiles)
On DEV: Number of logical tiles: 103680000/1440000=72
STEP2a: Simulate generateGraph and test node and edge id generations.
NOTE: This will not save anything in database
nohup ${PCH_APP_HOME}/run_CostBasedGridGraphGenerator.sh --action simulateGenerateGraph --costspec ${G2K_DATA_HOME}/simple_cost_spec_by_db.json > $PCH_LOG_HOME/nohup.out 2>&1 &
Review log file: vi $PCH_LOG_HOME/GangaToKaveri.log
NOTE: you should see messages, "generateGridGraph: sim" and should not see any error.
STEP2b: run generateGraph in single process in one or more batches
To generate the graph in single process in batches:
vi ${PCH_APP_HOME}/run_CostBasedGridGraphGenerator_Batches_by_db.shvi ${PCH_APP_HOME}/run_CostBasedGridGraphGenerator_Batches_by_db.shTo run in three batches: (for PROD)
nohup ${PCH_APP_HOME}/run_CostBasedGridGraphGenerator_Batches_by_db.sh 0 3 > $PCH_LOG_HOME/nohup.out 2>&1 &nohup ${PCH_APP_HOME}/run_CostBasedGridGraphGenerator_Batches_by_db.sh 0 3 > $PCH_LOG_HOME/nohup.out 2>&1 &To run in six batches:
nohup ${PCH_APP_HOME}/run_CostBasedGridGraphGenerator_Batches_by_db.sh 0 6 > $PCH_LOG_HOME/nohup.out 2>&1 &nohup ${PCH_APP_HOME}/run_CostBasedGridGraphGenerator_Batches_by_db.sh 0 6 > $PCH_LOG_HOME/nohup.out 2>&1 &To run in single batch:
nohup ${PCH_APP_HOME}/run_CostBasedGridGraphGenerator_Batches_by_db.sh 0 1 > $PCH_LOG_HOME/nohup.out 2>&1 &
<<Alternatively: nohup ${PCH_APP_HOME}/run_CostBasedGridGraphGenerator.sh --action generateGraph --yesIReallyWantToDo true --costspec ${G2K_DATA_HOME}/simple_cost_spec_by_db.json > $PCH_LOG_HOME/nohup.out 2>&1 &>>
nohup ${PCH_APP_HOME}/run_CostBasedGridGraphGenerator_Batches_by_db.sh 0 1 > $PCH_LOG_HOME/nohup.out 2>&1 &
<<Alternatively: nohup ${PCH_APP_HOME}/run_CostBasedGridGraphGenerator.sh --action generateGraph --yesIReallyWantToDo true --costspec ${G2K_DATA_HOME}/simple_cost_spec_by_db.json > $PCH_LOG_HOME/nohup.out 2>&1 &>>WARNING Batches parameter for run_CostBasedGridGraphGenerator_Batches_by_db.sh MUST BE such that rowSize is divisible by (pagedGraphGridNodesInRow * batches)
STEP3: finalizeGenerateGraph
After running ALL the graph generator processes, run finalizeGenerateGraph:
nohup ${PCH_APP_HOME}/run_CostBasedGridGraphGenerator.sh --action finalizeGenerateGraph --yesIReallyWantToDo true --costspec ${G2K_DATA_HOME}/simple_cost_spec_by_db.json --paginationspec ${G2K_DATA_HOME}/runtime_cost_spec_by_db.json > $PCH_LOG_HOME/nohup.out 2>&1 &
<<Reports: verifyGraphDataSet: totalNodes: 1419072160/0 totalEdges: 11351130099/0 maxNodeId: 1542232799/0 maxEdgeId: 12337862396/12337862396>>
NOTE:
This will generate "runtime_cost_spec_by_db.json" that is essential for all future steps
Also, this step creates activity_log row entry including the essential information for future reference
python -m json.tool ${G2K_DATA_HOME}/runtime_cost_spec_by_db.json
STEP4: Full-scan fix/verification of generated graph
WARNING
Fix/verification is required and necessary step to remove orphan edge references in nodes
Also, nodes' edges are not sorted by generateGraph stage. This step sorts the neighbors as part of post-generateGraph tasks.
E-g. orphan edge: When node1 -> node2 edge is created, node2 -> node1 is ASSUMED to going to exist. However, node2 -> node1 may be skipped due to some capping constraints.
Hence, the pre-assumed node2 -> node1 edge will have to be removed in node1's list.
WARNING Make sure to complete finalizeGenerateGraph step to collect metrics
Verifying and sorting/fixing right after graph generation:
${PCH_APP_HOME}/run_GridGraphGeneratorVerifyAndFix.sh <<NO_OF_TILES>> <<BATCH_START_AT>> <<TOTAL_BATCHES>>
nohup ${PCH_APP_HOME}/run_GridGraphGeneratorVerifyAndFix.sh 1071 0 17 > $PCH_LOG_HOME/nohup.out 2>&1 &
NOTE:
Runs verify in 17 batches for 1017 tiles -- starting at sequence 0
STEP5: Save DEM Image specs and project scope for future usage
WARNING Many future operations (such as routing REST, linking, clustering) would use this spec from database -- so that these operations do not need access to GBs of DEM files.
${PCH_APP_HOME}/run_CostBasedGridGraphGenerator.sh --action saveDEMRasterImageAccessorConfig --costspec ${G2K_DATA_HOME}/simple_cost_spec_by_db.json
${PCH_APP_HOME}/run_CostBasedGridGraphGenerator.sh --action saveGraphScopeSpecs --costspec ${G2K_DATA_HOME}/simple_cost_spec_by_db.json
NOTE: action saveGraphScopeSpecs saves in g2k_graph_scope_specs table that could be used as layer for routing service
STEP6a: Delink nodes and edges that are out of project scope
This step will delink all nodes that are outside the project scope. For e-g., nodes that fall outside the land-polygons of the project
Pre-requisite: Please complete, "shp2pgsql: Importing land boundaries to PostGreSQL"
SET statement_timeout=3600000; lock_timeout=3600000;
SET statement_timeout = 19200000; SET lock_timeout=1200000; SET work_mem TO '2048MB';
On four/six pgsql sessions, run:
SELECT 50000 AS batch_size, -1 AS start_node_id, 96389549 AS end_node_id \gset
SELECT 50000 AS batch_size, 96389549 AS start_node_id, 192779098 AS end_node_id \gset
SELECT 50000 AS batch_size, 192779098 AS start_node_id, 289168647 AS end_node_id \gset
SELECT 50000 AS batch_size, 289168647 AS start_node_id, 385558199 AS end_node_id \gset
SELECT 100000 AS batch_size, 385558199 AS start_node_id, 771116398 AS end_node_id \gset
SELECT 100000 AS batch_size, 771116398 AS start_node_id, 1156674597 AS end_node_id \gset
SELECT 100000 AS batch_size, 1156674597 AS start_node_id, -1 AS end_node_id \gset
CALL g2k_exclude_nodes_by_land_polygons(:batch_size, :start_node_id::bigint, :end_node_id::bigint, true);
NOTE:
First batch (-1 to 385558199) are splitted further and runs with 50000 as batch_size -- since this batch is for southern India -- containing large sea-area exclusions.
STEP6b: finalizeGenerateGraph (again)
After fixing and delinking the nodes, run finalizeGenerateGraph once again:
nohup ${PCH_APP_HOME}/run_CostBasedGridGraphGenerator.sh --action finalizeGenerateGraph --yesIReallyWantToDo true --costspec ${G2K_DATA_HOME}/simple_cost_spec_by_db.json --paginationspec ${G2K_DATA_HOME}/runtime_cost_spec_by_db.json > $PCH_LOG_HOME/nohup.out 2>&1 &
<<Reports: verifyGraphDataSet: totalNodes: 1350969135/0 totalEdges: 11841728566/0 maxNodeId: 1542207598/0 maxEdgeId: 12337862395/12337862395>>
NOTE:
This will generate "runtime_cost_spec_by_db.json" that is essential for all future steps
Also, this step creates activity_log entry including the essential information for future reference
STEP7: Apply soil-cost to edges
SET statement_timeout = 18600000; SET lock_timeout=1200000; SET work_mem TO '2048MB';
SELECT 1 AS percentile_step, 2500 AS loop_step \gset
CALL g2k_apply_soilgrids_cost_to_node_pct_h1(0, 10, :percentile_step, :loop_step, true);
CALL g2k_apply_soilgrids_cost_to_node_pct_h1(10, 20, :percentile_step, :loop_step, true);
CALL g2k_apply_soilgrids_cost_to_node_pct_h1(20, 30, :percentile_step, :loop_step, true);
CALL g2k_apply_soilgrids_cost_to_node_pct_h1(30, 40, :percentile_step, :loop_step, true);
CALL g2k_apply_soilgrids_cost_to_node_pct_h1(40, 50, :percentile_step, :loop_step, true);
CALL g2k_apply_soilgrids_cost_to_node_pct_h1(50, 60, :percentile_step, :loop_step, true);
CALL g2k_apply_soilgrids_cost_to_node_pct_h1(60, 70, :percentile_step, :loop_step, true);
CALL g2k_apply_soilgrids_cost_to_node_pct_h1(70, 80, :percentile_step, :loop_step, true);
CALL g2k_apply_soilgrids_cost_to_node_pct_h1(80, 90, :percentile_step, :loop_step, true);
CALL g2k_apply_soilgrids_cost_to_node_pct_h1(90, 100, :percentile_step, :loop_step, true);
The result of the node/edge graph having land elevation and soil-type as the cost of the edges.
Below is the gradient-colored visualization of edge costs around Prayagraj (around the confluence of Ganga and Yamuna rivers)
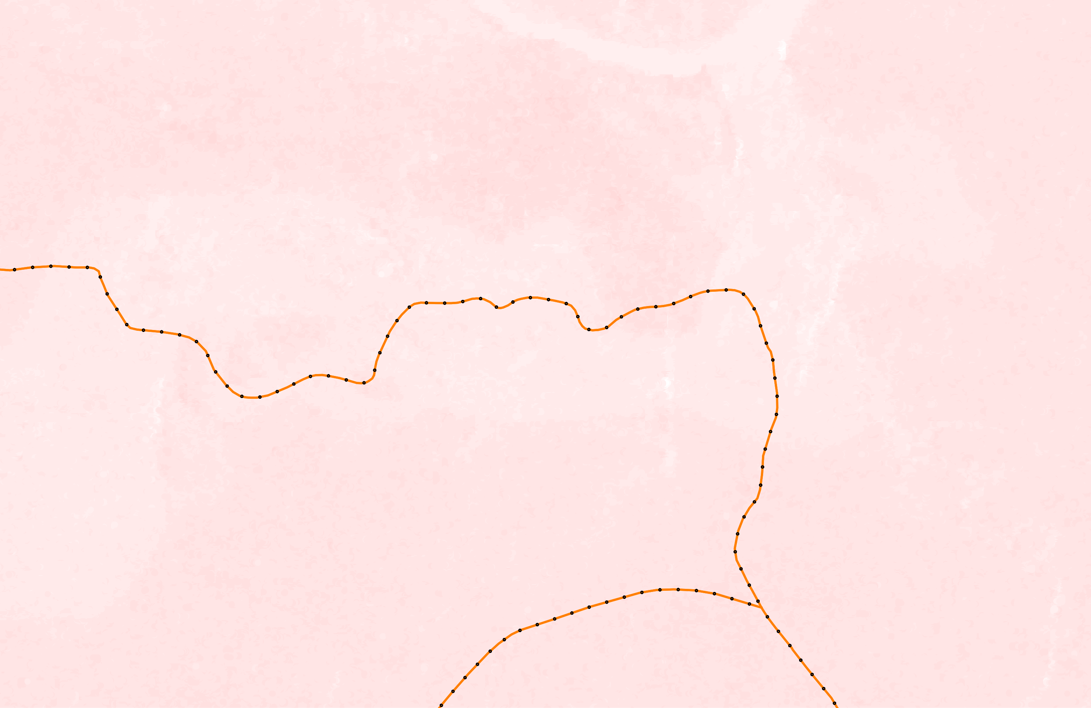
Ref: g2k_elevation_around_prayagraj_0504220226.png